
BigShort visualizes these forces on one chart — so you can see what's really happening.
See when institutions are quietly buying or selling before price reacts.
SmartFlow tracks real-time institutional order flow to reveal hidden accumulation and distribution patterns — giving you a head start before the move shows on the chart. Rigorously backtested across multiple timeframes, with a proven, statistically significant edge.
Know whether big money is betting on upside or downside — on any ticker, in real time.
Net Options Flow aggregates options transactions into a single directional read — available per symbol on any ticker you pull up, and for the broader market as a whole. When big money is loading calls or puts on the name you're watching, you'll see it before the move.
See the big picture behind options positioning — not just single trades, but the trend.
NOFA tracks the cumulative sum of net options flow over time, revealing whether institutions are steadily building bullish or bearish positions. While individual flow spikes can be noise, accumulation shows persistent conviction — helping you stay on the right side of the move.
Spot where large block trades are printing — these levels become real support and resistance.
The majority of U.S. equities volume now trades off-exchange — so dark pool prints are where institutional capital is quietly accumulating or distributing, out of sight of the public tape. Those levels stick: prints below price tend to hold as support, prints above tend to cap rallies as resistance.
See when discretionary traders are chasing — and when they're strong enough to break out.
MomoFlow tracks the flow of human, discretionary traders — from small retail up to hedge fund desks. When MomoFlow and FastFlow push hard in the same direction, it usually signals that discretionary money has overextended and a reversal is near. But when MomoFlow runs unexpectedly strong, it can overrun the market makers and stampede price into a real breakout. Reading both cases is the edge.
The fast, paper-handed money that amplifies moves — then bails.
FastFlow tracks the short-horizon algorithmic traders that pile into momentum and retrace just as quickly. They exaggerate moves on the way in, but rarely stick around to defend them. Read alongside MomoFlow, FastFlow strengthens the reversal case — when both are stretched in the same direction, the move is usually running on borrowed time.
The price magnet dealers hedge around — price gets pulled back here.
Gravity HP calculates the hedge point where dealer exposure is most concentrated. Price gravitates to this level, making it a high-probability target for mean-reversion trades.
The intraday gamma levels dealers are forced to defend.
Call HP and Put HP track where gamma exposure is building against dealers in real time. The lines move on the chart throughout the day — defining the intraday support and resistance zones where price actually reacts.
Tells you if the market will mean-revert or trend — before you enter.
GEX Regime shows whether gamma exposure is positive or negative, telling you whether to expect range-bound chop or a trending breakout.
See whether options traders are hedging fear or chasing greed.
Skew measures the imbalance between put and call demand, revealing whether the market is positioned for protection or speculation. It's backed by a deep body of peer-reviewed academic research showing persistent predictive edge on forward returns.
A glitch in the matrix — subtle shifts in dealer positioning that leak their hand.
MM Skew tracks small, deliberate changes in market maker positioning in real time. Dealers don't want to signal weakness, so the moves are usually quiet — but those quiet shifts still tell you which side they're leaning, and where they're likely to lean into the tape.
Our proprietary short-squeeze signal — and a crowd favorite in the community.
The Honey Badger is a high-conviction signal built on our proprietary short-squeeze indicator. In our internal backtests it prints a 90% win rate*, and it's become one of the most-watched calls among BigShort subscribers.
*Based on internal backtesting. Past performance is not indicative of future results.
A high-signal tell that market makers are short in size — and under pressure.
Short Exempt orders are marked when a market maker shorts without a locate — almost always to hedge existing exposure. Clusters of these prints reveal where dealers are short and under real pressure. When they get squeezed out of those shorts, price typically runs higher.
Find the closest historical analogues to today's price action — and see what happened next.
Similarity Search scans years of intraday data to surface the days that most closely match the shape of the current session. Overlay the analogues, see the median path, and quantify the range of likely outcomes — pattern-recognition with statistical backing instead of pure intuition.
See options blocks, sweeps, and splits in real-time, overlaid onto the SmartFlow chart for faster decision making. Dark pool transactions are also visualized, making support and resistance levels easy to spot.
| Time | Sym | Side | Strike | Exp | Prem |
|---|---|---|---|---|---|
| 10:42:18 | NVDA | CALL GOLDEN | 880 | 05/17 | $2.40M |
| 10:41:55 | SPY | PUT BRONZE | 538 | 04/19 | $1.80M |
| 10:41:32 | TSLA | CALL | 250 | 05/17 | $0.82M |
| 10:40:58 | QQQ | CALL BRONZE | 475 | 04/19 | $0.64M |
| 10:40:21 | NVDA | PUT | 860 | 05/17 | $1.10M |
| 10:39:47 | AAPL | CALL | 195 | 06/21 | $0.48M |
| 10:39:12 | META | CALL GOLDEN | 520 | 05/17 | $1.50M |
| 10:38:40 | AMD | PUT | 160 | 04/26 | $0.32M |
OptionFlow is also available in list form in its own pane — across all major stocks.
Join thousands of traders who see what others can't.
Get Access to BigShort — $37Executives sell for many reasons. They usually buy for one.
BigShort tracks insider purchases and sales across major companies — and plots them directly on the chart, at the price and time they happened, so you can see them in context with flow, dark pool prints, and price action.
Monitor directors, CEOs, CFOs, and officers. See who is adding size. See who is reducing exposure.
Dark pools are where large orders execute quietly — and the majority of all U.S. equities volume now trades off-exchange, out of sight of the public tape. BigShort surfaces those prints across major stocks so you can see what the tape isn't showing you.
Large funds cannot enter positions in one click. Dark pool clusters often define hidden support and resistance, reinforce the real bid or ask away from on-screen price, and confirm institutional intent.
See the forces behind every move.
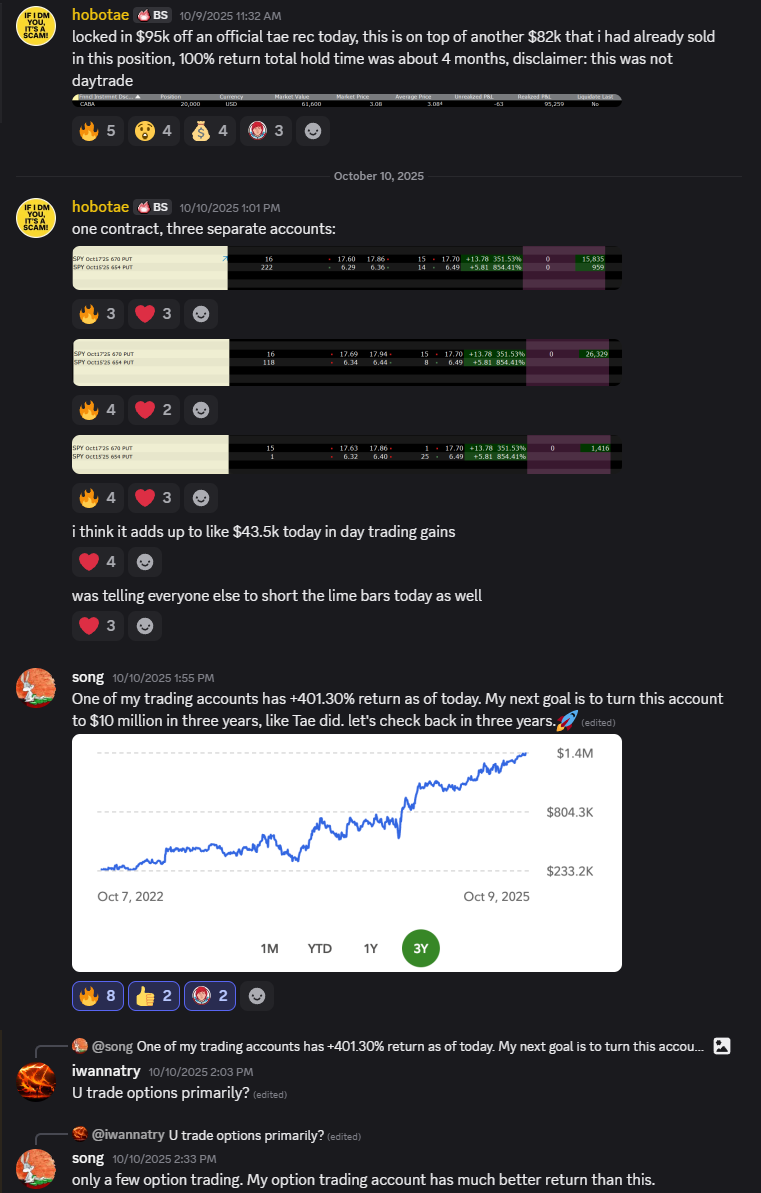
Get Access to BigShort — $37Real messages from the BigShort community — traders using the same tools, sharing the same setups.
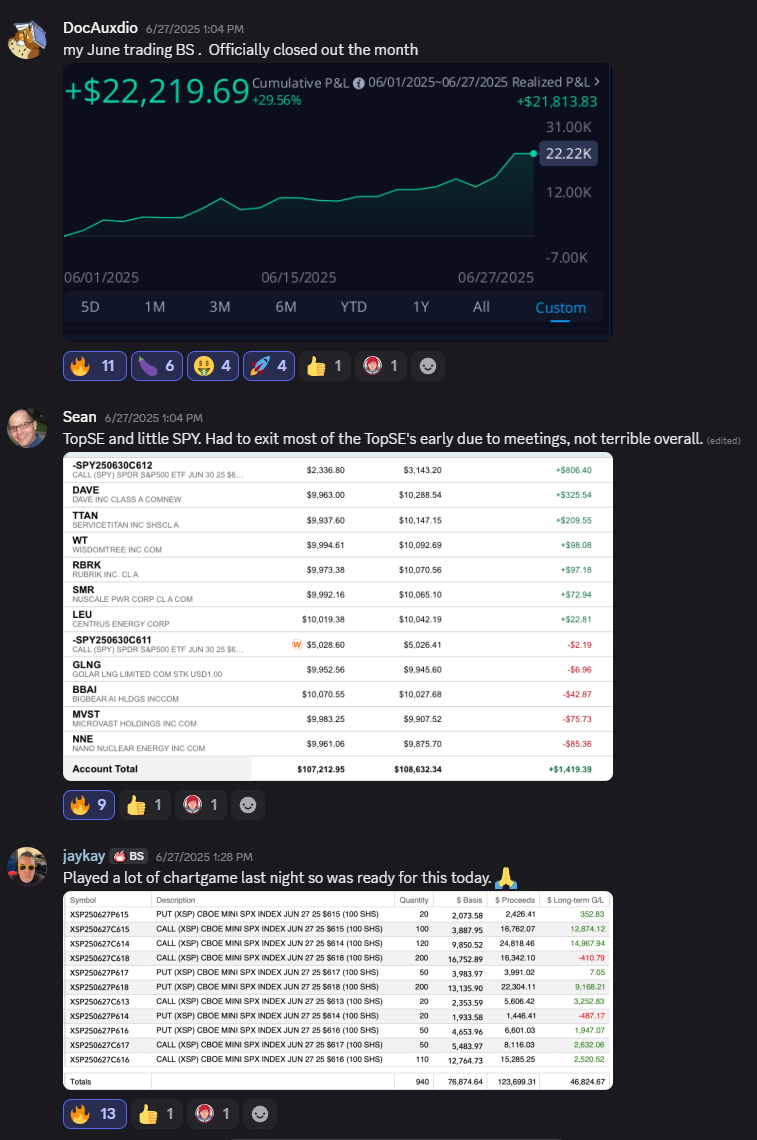
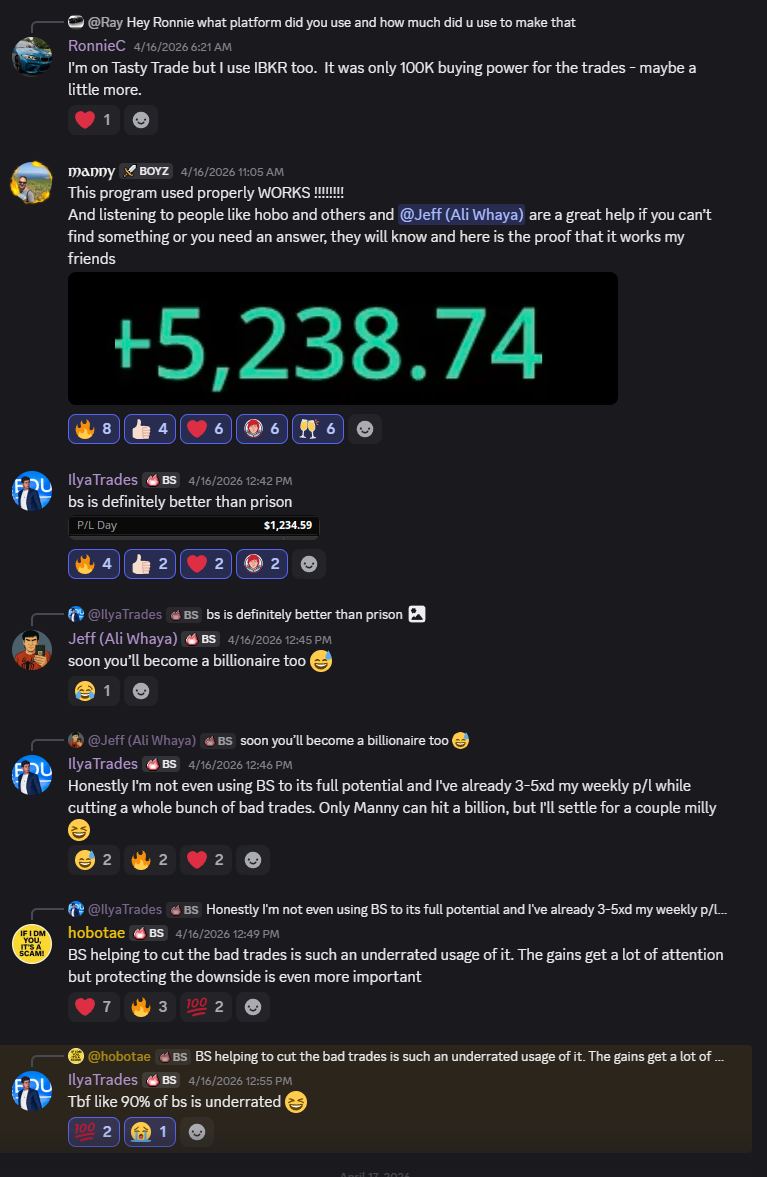
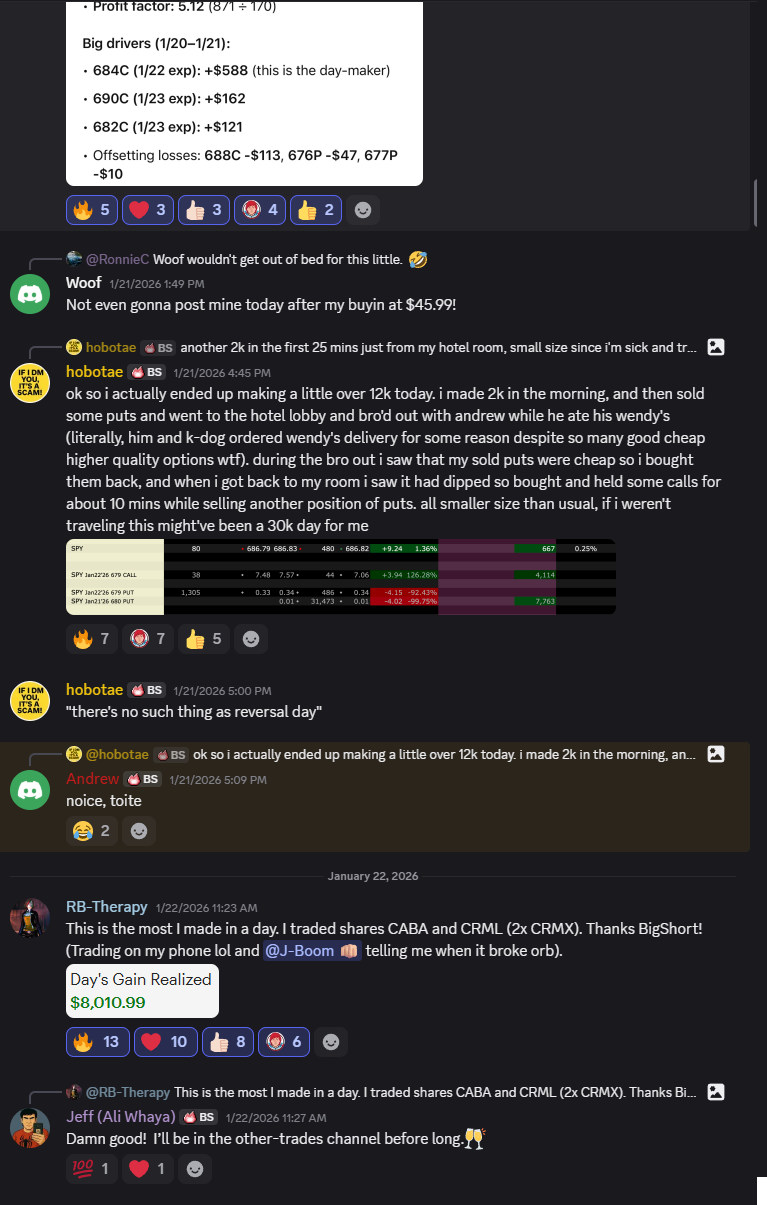
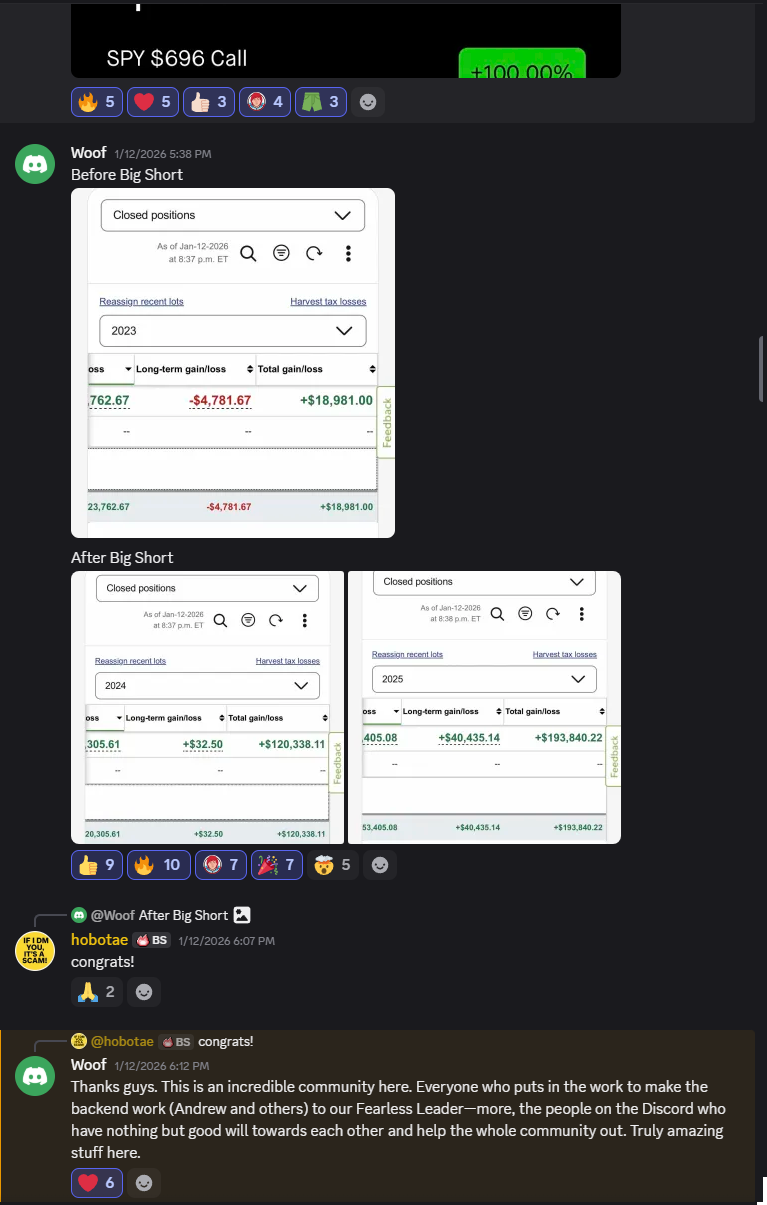
Access the data that hedge fund managers use for just $37.
Get Access to BigShort